In today’s vast digital landscape, your website is the hub of interactions between your business and your audience. It's where potential customers explore your offerings, where leads are born, and where deals are sealed.
As businesses try to stand out in this bustling digital arena, the question comes up: Is your digital presence reaching the right people? Are you harnessing the full potential of data-driven insights to tailor your strategies, enhance user experiences, and drive revenue growth?
That’s where web analytics—the process of collecting, measuring, and analyzing data from your website and online activities—come in.
Today, we embark on a journey into the world of web analytics. From understanding how data is collected to deciphering the key metrics that matter most, this comprehensive guide will equip you with the knowledge to make informed decisions that resonate with your audience and fuel your business's success.
By the end of this journey, you'll not only understand web analytics but also appreciate why it's not a luxury but a necessity in today's data-driven landscape. Get ready to transform your digital strategies, one data point at a time.
Web analytics basics
Understanding web analytics begins with how data is collected from your website visitors. Here’s a closer look.
How is data collected?
Cookies are small pieces of data stored in users' web browsers. They help identify and remember users, tracking their online movements and interactions with your website. This valuable information can highlight user preferences, allowing you to optimize their experiences. Cookies also allow users to do things like save their password on a website so they don’t have to re-enter it every time they visit.
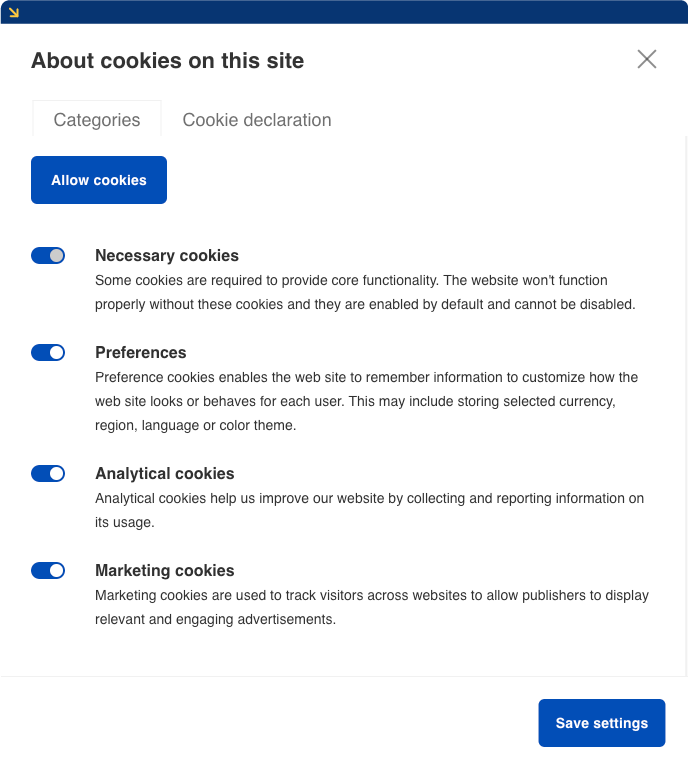
Example of a cookies declaration on dealfront.com
Tracking codes are snippets of code embedded in websites to monitor user interactions and gather data on visitor behavior. Third parties like Meta and Google have tracking codes you can add to your business’ website. The data then goes to those third-party companies, which process the data so you can analyze it to see how your website is performing.
Cookies and tracking codes help you monitor user interactions and events, which are the actions users take while navigating your digital terrain. These interactions include clicks on links, buttons, and images, as well as form submissions and downloads.
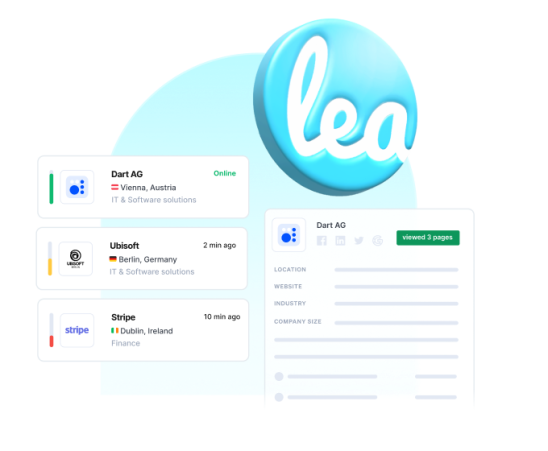
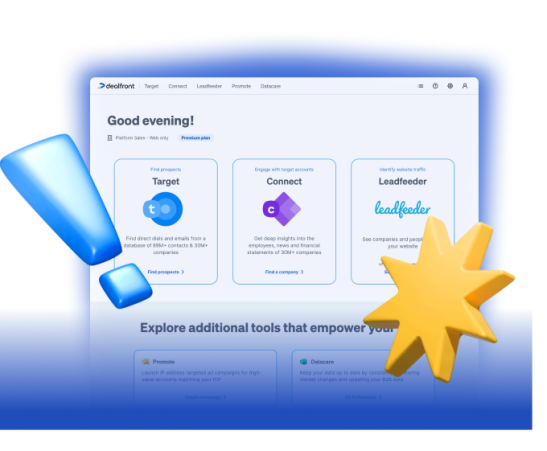
It can get complicated to monitor and analyze all that data, which is where a tool like Dealfront’s Leadfeeder comes in. Leadfeeder is a GDPR-compliant software that helps you:
Track businesses that visit your site in real-time
Get insight into their interests
Automatically score leads
Send data to your sales team for follow-up
This makes it easier to grow your pipeline with leads that show high buying intent.
Types of data collected
Traffic data shows how visitors arrive at and navigate your website. Metrics in this category include the number of visitors, how long they stay on your site, and where they came from.
Another important type of data is user behavior data. This includes things like:
How far down the page a visitor scrolls
How long they stay on your website
The percentage of visitors who leave your website after only visiting one page (bounce rate).
Leadfeeder helps you extract insights from this data and use it strategically. For example, you can use it to identify the companies visiting your website and automatically send them to your CRM for your sales team to convert.
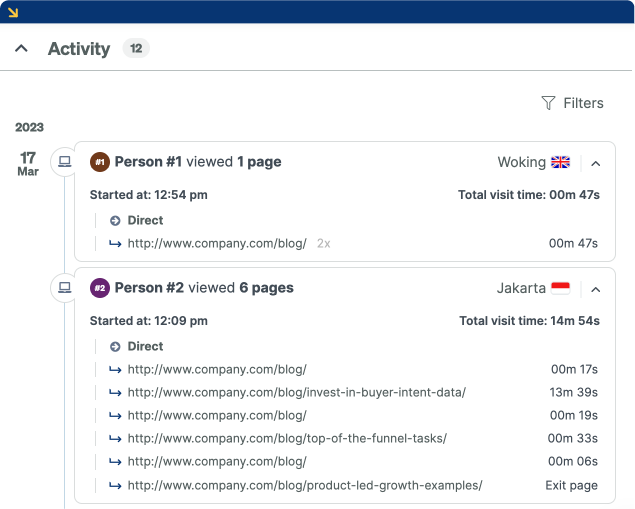
Finally, conversion data refers to actions visitors take that align with your business goals, including:
Email signup rate: The rate at which visitors subscribe to your email newsletter or updates, indicating interest in staying connected with your brand.
Downloads: Tracking the number of times users download resources, such as e-books, white papers, or software, showing engagement with your content.
Sales revenue: The total revenue generated from online sales, including individual product sales, subscriptions, or other transactions.
Click-through rate (CTR): The percentage of users who click on an advertisement or call to action (CTA) compared to the number of times it was displayed.
Common web analytics tools
Data is nothing with the tools to analyze it. Web analytics tools are instrumental in deciphering the intricacies of your online presence, and one standout among them is Google Analytics. It provides a comprehensive view of your website's performance, covering crucial metrics such as:
Traffic analysis: Google Analytics unveils the sources of your website traffic, including organic search, direct visits, referral links, and more.
User behavior insights: The tool tracks user behavior, such as page views, session durations, and bounce rates, showing how visitors engage with your content.
Conversion tracking: Google Analytics allows you to set up goals and track conversions like completing a purchase or signing up for a newsletter.
Other web analytics tools include Leadfeeder, Kissmetrics, Adobe Analytics, Hotjar, Matomo (formerly Piwik), SimilarWeb, and Ahrefs.
Now that we understand how data is collected and what tools companies commonly use to collect and analyze that data, let’s look at some of the metrics in web analytics.
Key metrics in web analytics
Metrics are quantifiable measurements or data points used to assess, track, and analyze various aspects of a system. They give you data to use for decision making, so you can pinpoint exactly where potential leads are falling through the cracks and catch them before they do.
Traffic metrics
Traffic metrics provide businesses with invaluable insights into the reach and engagement of their websites. Three key traffic metrics stand out: pageviews, unique visitors, and traffic sources.
Pageviews
Pageviews indicate how often a particular page on your website is viewed. Each pageview represents a visitor's interaction with your content, making it a vital measure of engagement. Monitoring pageviews helps identify popular content, so you can create more of what resonates with your audience.
Unique visitors
A unique visitor is someone who has visited your website at least once. This metric is crucial for understanding the scope of your online reach and audience engagement. It distinguishes between first-time and returning visitors so you can assess how effectively you attract and retain your audience.
Traffic sources
Ever wonder if your social media efforts are effective? Tracking your traffic sources can help. That way you know where your visitors are coming from and how they’re finding your website. There are various types of traffic sources, including:
Organic search: Visitors who find your website through search engines like Google.
Direct traffic: Users who directly type your website's URL into their browser, indicating strong brand recognition or word-of-mouth referrals.
Referral traffic: Visitors who arrive via links from other websites or platforms.
Social media: Traffic generated from social media platforms.
Engagement metrics
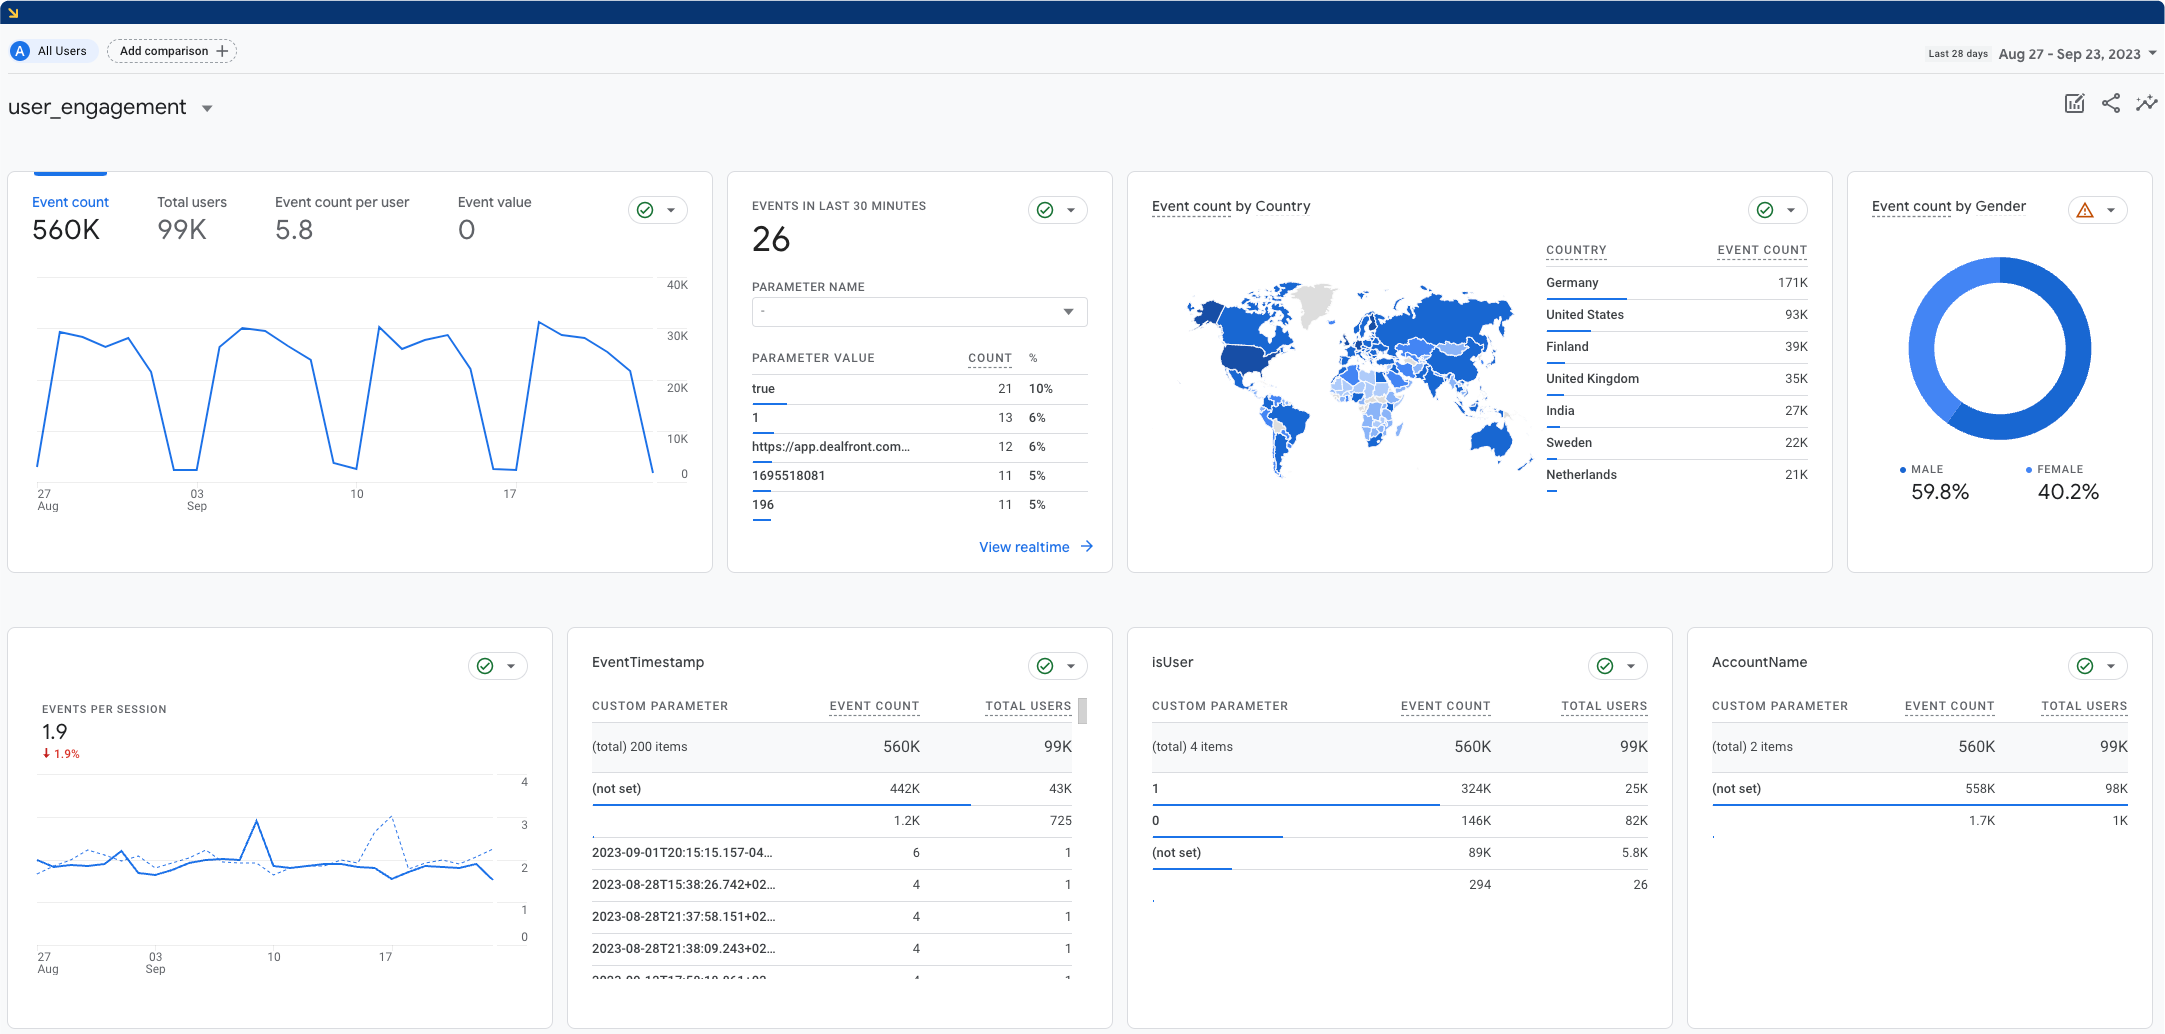
You’ve probably heard marketers talk a lot about “engagement”, but it’s not just a buzzword. Engagement is how you measure the way users interact with your content. Bounce rate, average session duration, and pages per session are three key engagement metrics to watch.
Bounce rate
Bounce rate represents the percentage of users who navigate away from your website after viewing only one page. A high bounce rate often signals that the initial experience didn't capture the visitor's interest or meet their expectations.
A low bounce rate, on the other hand, indicates that visitors are engaging with your content and exploring further. Monitoring bounce rates gives you insights into the effectiveness of your content and user experience.
Average session duration
Average session duration measures the average amount of time visitors spend on your website during a single visit. A longer session duration suggests that visitors are actively engaging with your content, while a shorter duration may indicate that they didn't find what they were looking for.
This metric helps businesses assess the effectiveness of their content, user interface, and navigation. Aiming for longer session durations can lead to a more immersive user experience, which boosts the chances of achieving specific goals, such as content consumption or conversions.
Pages per session
Pages per session represent the average number of pages viewed by a visitor during a single session on your website. A higher pages per session value typically indicates that users are exploring multiple pieces of content and showing an interest in your offerings.
Aiming to increase pages per session can lead to a richer user experience, as visitors delve deeper into your content and discover more of what your website has to offer.
Conversion metrics
You can have all the traffic and engagement in the world, but the ultimate goal for a B2B business is getting customers and closing deals. That’s what conversion metrics are all about.
Conversion metrics measure how effective your digital assets are at getting your visitors to take specific actions. To understand conversion metrics, you need to understand what conversions, conversion rates, and revenue tracking are.
Goals and conversions
Just as a captain sets a course for a specific destination, businesses define goals to outline their digital objectives. These goals can be diverse, ranging from encouraging users to sign up for a newsletter or complete a purchase to getting visitors to spend more time on your website.
Conversions occur when users take a desired action that aligns with your established goals. For example, if you need more sales calls, a conversion might be when a website visitor uses your online calendar to make a phone appointment. Conversions represent successful outcomes.
Conversion rate
Conversion rate is the percentage of users who complete a desired action (conversion) out of the total number of visitors. A high conversion rate indicates that a significant portion of visitors are successfully navigating the digital journey. While a low rate suggests room for improvement.
Businesses monitor conversion rates to assess the effectiveness of their sales and marketing strategies and identify areas that require optimization. Whether it's refining the user experience, enhancing content, or streamlining the checkout process, conversion rate data guides businesses in steering their digital efforts toward higher efficiency and greater success.
Revenue tracking
Revenue tracking involves monitoring and measuring the financial impact of online activities like purchases, subscriptions, or ad revenue. Understanding revenue generated from various sources and activities allows you to allocate resources wisely and prioritize efforts that contribute most to your bottom line.
The ultimate goal of monitoring these metrics, of course, is to achieve business goals—that’s where goals and key performance indicators (KPIs) enter the picture.
Why goals and KPIs are important
Goals and KPIs are like the scoreboard in a sports game. They keep track of progress, measure performance, and determine the winner. Without them, you're playing the game blindly, with no way to gauge how well you're doing or what you need to improve to secure victory.
Setting clear and achievable goals and KPIs is a central part of successfully using web analytics. Here's how to navigate this critical process:
Understand your objectives: Start by gaining a deep understanding of your business objectives. What do you aim to achieve? Are you looking to increase sales? Enhance brand awareness? Or improve customer retention? Clear business objectives lay the foundation for effective goal-setting.
Make goals specific: Goals should be specific, measurable, attainable, relevant, and time-bound (SMART). For instance, instead of a vague goal like "increase website traffic," aim for a specific target like "increase organic website traffic by 20% within six months."
Identify KPIs: KPIs are the metrics that help you track progress towards your goals. Choose KPIs that directly align with your objectives. If your goal is to boost free trial signups, relevant KPIs might include signups to your email list, signups via your “try now” button, and conversions from free users to paid users.
Set benchmarks: Establish benchmarks or baseline data to measure progress. This provides context and allows you to gauge whether you're moving in the right direction.
Regularly review and adjust: Goals and KPIs are not set in stone. Regularly review your progress and adjust them as needed. If you're falling short of a goal, consider revising your strategy or timeline.
The next step is knowing how to interpret all this data.
How to interpret web analytics data
If KPIs are like a scoreboard, then interpreting web analytics is like being a color commentator interpreting the game for viewers. Interpreting web analytics data comes down to four key areas: analyzing traffic sources, understanding user behavior, identifying conversion bottlenecks, and A/B testing and experimentation. Let’s explore in more depth.
1. Analyzing traffic sources
Examining traffic sources involves categorizing visitors into distinct groups like organic search, direct traffic, referral traffic, and paid advertising. Analyzing traffic sources lets you:
Allocate resources like your ad budget strategically
Identify which channels drive the most engagement
Refine your marketing accordingly
2. Understanding user behavior
Understanding user behavior involves tracking the actions users take, such as page views, clicks, time spent, and interactions with content. These insights provide a comprehensive view of how visitors engage with your website.
Interpreting user behavior data helps you:
Identify popular content and areas of interest
Uncover navigation bottlenecks or areas of confusion
Optimize the user experience for higher engagement and conversions
Tailor content and strategies to match visitor preferences and needs
3. Identifying conversion bottlenecks
Identifying conversion bottlenecks involves pinpointing the specific points in the user journey where visitors tend to drop off or fail to complete desired actions. Such as, making a purchase or signing up for a newsletter.
Common conversion bottlenecks include complex onboarding processes, lack of a clear value proposition, and pricing page confusion. These bottlenecks leave visitors feeling overwhelmed, unclear at the benefit a product could give them, and confused about what different pricing tiers include.
By recognizing bottlenecks, you can:
Streamline the conversion process for a smoother user experience
Identify potential issues with website design or functionality
Implement targeted improvements to boost conversion rates
4. A/B testing and experimentation
A/B testing involves comparing two or more versions of a webpage or element to determine which one performs better in terms of user engagement or conversions. This helps you optimize those elements to increase conversions.
Here’s an example of what an A/B test looks like:
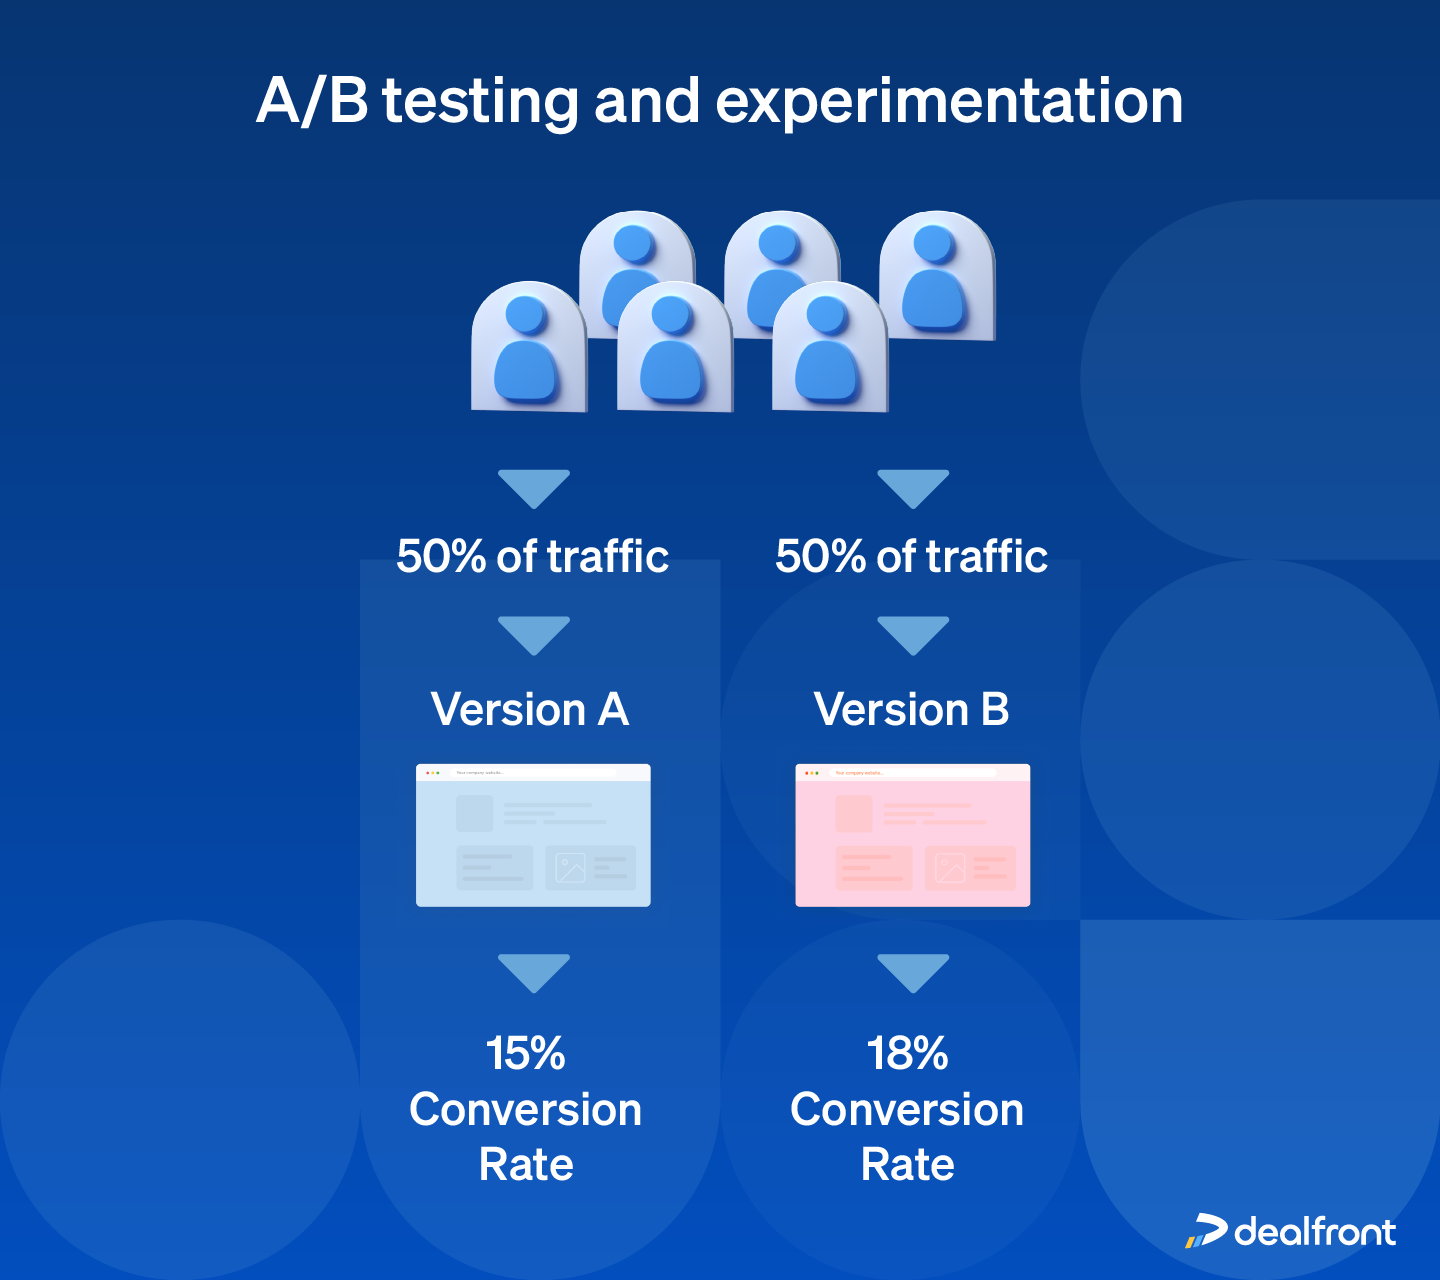
Objective: The objective is to boost calendar bookings for a product demo. The hypothesis is that by optimizing the appointment booking process, you’ll get more visitors to schedule appointments.
Version A (control):
The control version features the existing booking process.
Users need to navigate through multiple pages and steps to schedule an appointment, including filling out a detailed form.
Version B (variation):
In the variation, you update the website design.
You streamline the booking process to a single-page form with fewer fields and a clear, concise layout.
Implementation:
You use A/B testing software to create and track both versions of the website.
The software randomly directs visitors to either Version A or Version B when they access the booking page.
The software tracks and records user interactions and appointment bookings.
Results and analysis:
After running the A/B test for a defined period, you analyze the data. This includes heat maps that reveal user engagement patterns for both versions, including where users hover, click, and scroll.
The analysis includes the number of visitors who successfully booked appointments in both versions of the website.
Outcome:
Analysis of the A/B test data reveals that Version B, with the streamlined single-page booking form, results in a significantly higher rate of appointment bookings compared to Version A.
Consequently, you adopt Version B as the new process. This simplifies the booking process for visitors and increases bookings.
This A/B test illustrates how the marketing department can use web analytics to increase leads for the sales department. This brings us to our next point.
Web analytics for B2B sales and marketing
It’s all too easy for sales and marketing to be at odds with each other, but web analytics can benefit both departments and help them work together.
Web analytics for B2B sales
Web analytics can track your sales funnels by integrating customer relationship management (CRM) data with website analytics. This lets you trace customer journeys from their initial online interactions through to sales team engagement and ultimately, deal closures—a comprehensive view of the entire sales process. You can use this data to analyze the customer journey and where leads are dropping off so you can optimize accordingly.
Web analytics also aids in identifying high-value leads, allowing your sales team to prioritize its efforts effectively. With a tool like Leadfeeder, you get automatic lead scoring, so your best leads automatically go to the top of your lead list.
Additionally, web analytics assist in sales forecasting and predictive analytics by providing historical data on website interactions, customer behaviors, and conversion patterns. You can analyze this data to identify trends, make data-informed predictions about future sales, and adjust your strategies accordingly.
Web analytics for B2B marketing
In addition to sales, web analytics can be a huge help for B2B marketing. For example, web analytics can help you track lead generation by capturing data on website visitors' interactions, such as form submissions, downloads, and specific content views. Through lead tracking mechanisms, you can pinpoint the sources, channels, and content that most effectively convert visitors into leads. Then you can optimize your best-converting lead generation strategies and improve or eliminate your weak ones.
Another area where web analytics helps is measuring content marketing effectiveness. Tracking key metrics like page views and conversion rates for individual content pieces lets you identify high-performing content and replicate its success.
A third benefit comes into play with email marketing. For example, you can use web analytics tools to measure your email signups and identify pages and forms that you need to improve. And when you send your email subscribers to sales pages, you can track which pages convert the best.
Finally, by tracking engagement metrics such as likes, shares, comments, and click-through rates on social media posts and links. This data allows you to gauge the effectiveness of your social media strategies and identify which platforms and posts resonate most with your target audience.
To make sure you get these benefits, you need to employ web analytics best practices to get the highest quality data. This will help you use web analytics effectively while also respecting your website visitors’ privacy.
Web analytics best practices
If you want to get the most out of your web analytics, you’ll need to make sure you stick to these best practices:
Data accuracy and reliability: Regularly audit and clean data, train staff on data collection, and continuously test data collection to promptly identify and resolve issues.
Data privacy and compliance: Use software that anonymizes personally identifiable information, use popups to get consent for using cookies, collect only the data necessary for analytics purposes, train employees on data privacy, and create an incident response plan to address data breaches if they occur.
Continuous monitoring and optimization: Continuously conduct A/B tests, collect user feedback, and schedule regular review meetings or sessions to analyze performance data with your team.
Real-time vs. historical data analysis: Create a live dashboard that displays real-time metrics so you can monitor user behavior, traffic sources, and conversions as they happen. Set up regular reporting schedules to compile historical data and compare your current to your past performance and identify areas for improvement.
Using these best practice guidelines, you can maximize the benefits of web analytics for your B2B business.
Why web analytics is vital for your B2B business
Web analytics aren’t a luxury, they’re a necessity. They unravel the mysteries of your audience's behavior so you can tailor your strategies, improve user experiences, and drive revenue growth—all while staying GDPR-compliant.
Begin by setting clear goals and collecting accurate data with a tool like Google Analytics or Leadfeeder. And remember, using web analytics effectively is a continuous process of improvement, not a final destination.

